P:VAD
Comprehensive Diffusion Testing
Diffusion tests were conducted using 3D models at a scale of 5:1. Due to the size of the boxes, an anechoic chamber to undertake diffusion tests would need to have been the size of a sports hall. The tests were subsequently undertaken at scale size at the University of Salford in their small semi-anechoic chamber. Tests were performed to BS ISO 17497-2: 2012 - Measurements of the directional diffusion coefficient in a free field.
The tests were conducted on 8x scaled boxes in two different orientations; Orientation A with the boxes rotated so that the long convex curves were in a vertical position and Orientation B with the boxes rotated so that the long convex curves were in a horizontal position.
A boundary plane method was used, with the scattering measured in the plane being defined by the hard concrete floor of the semi-anechoic chamber. Measurements made using 37 microphones arranged in an arch shape, Spanning from -90° to 90° With angle steps of 5°.
The loudspeaker source angles used 0°, +-30° and +-60°.
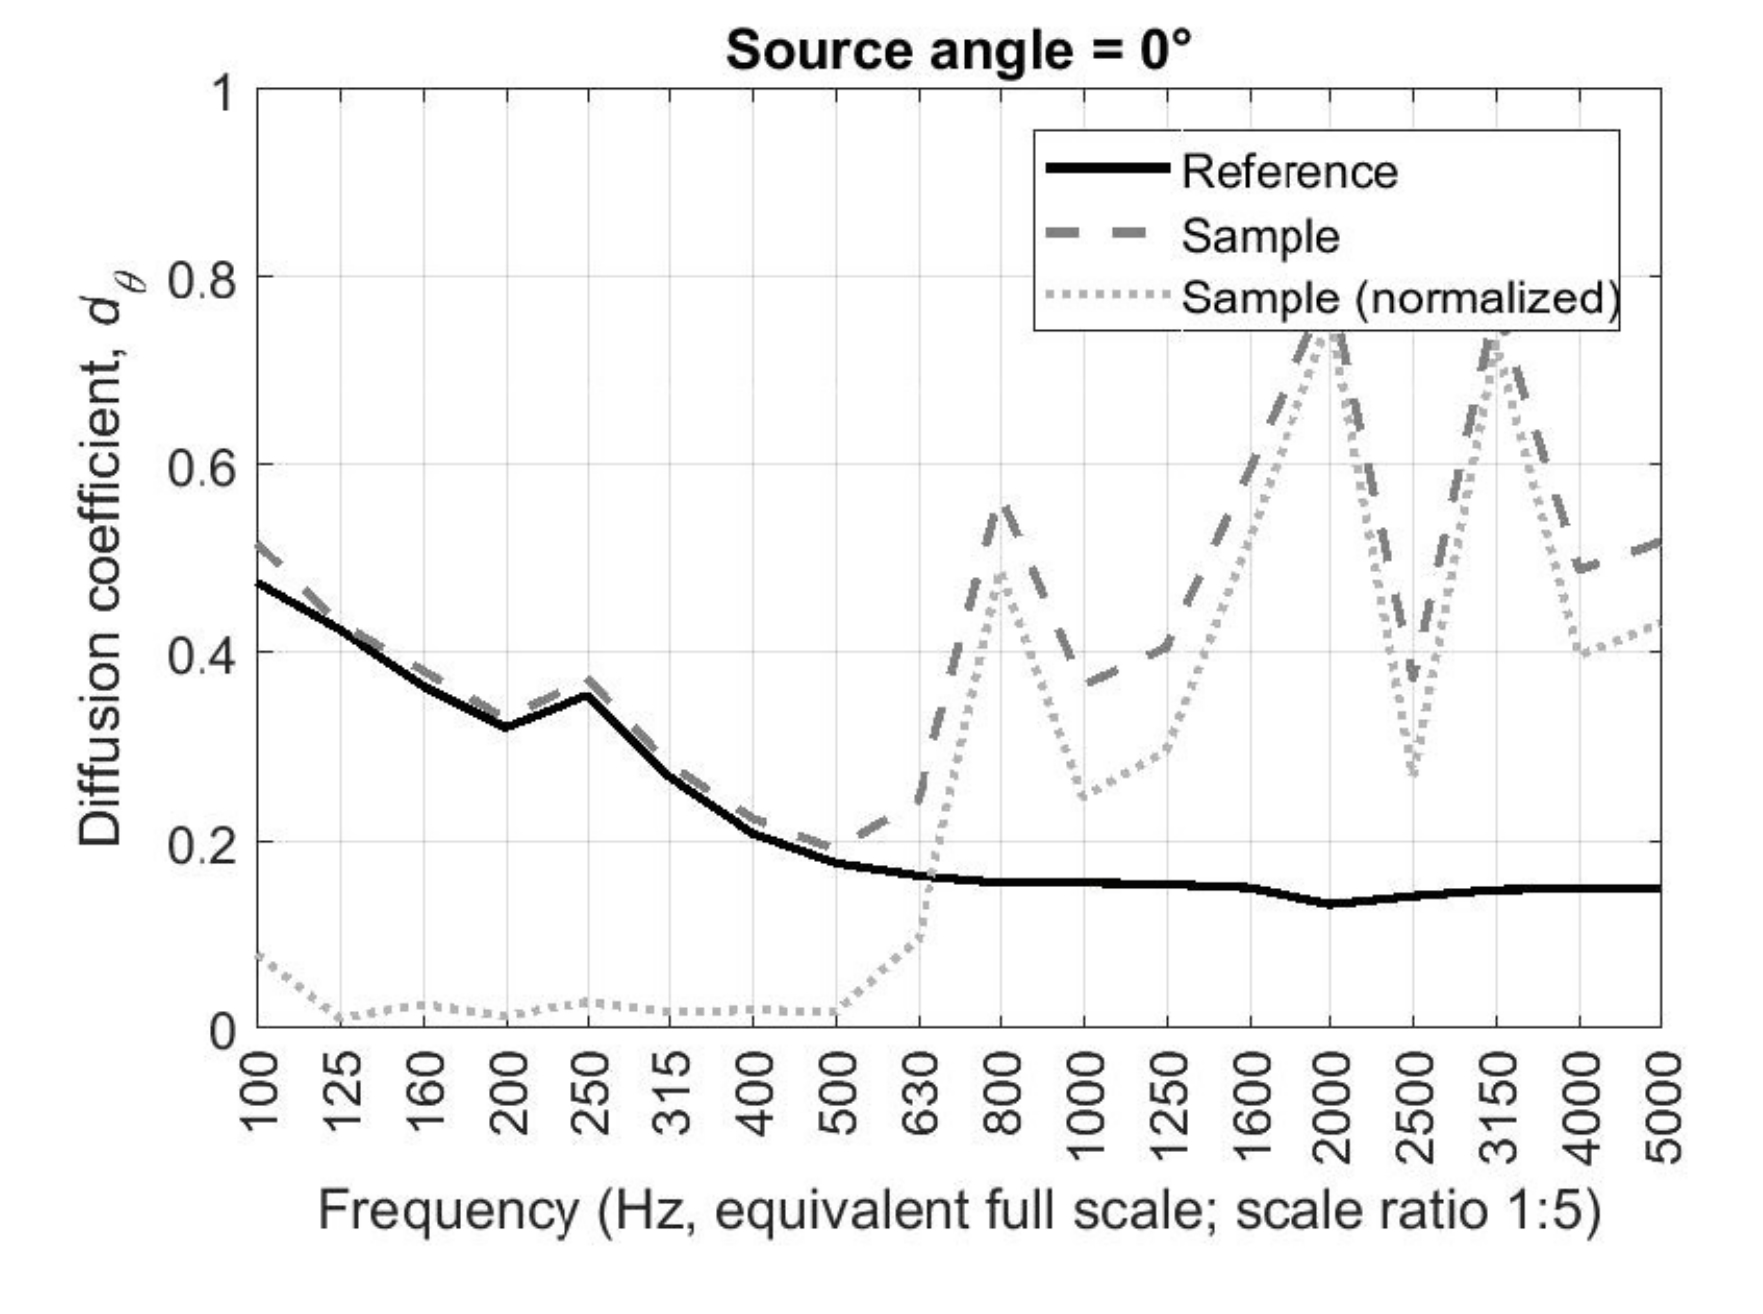
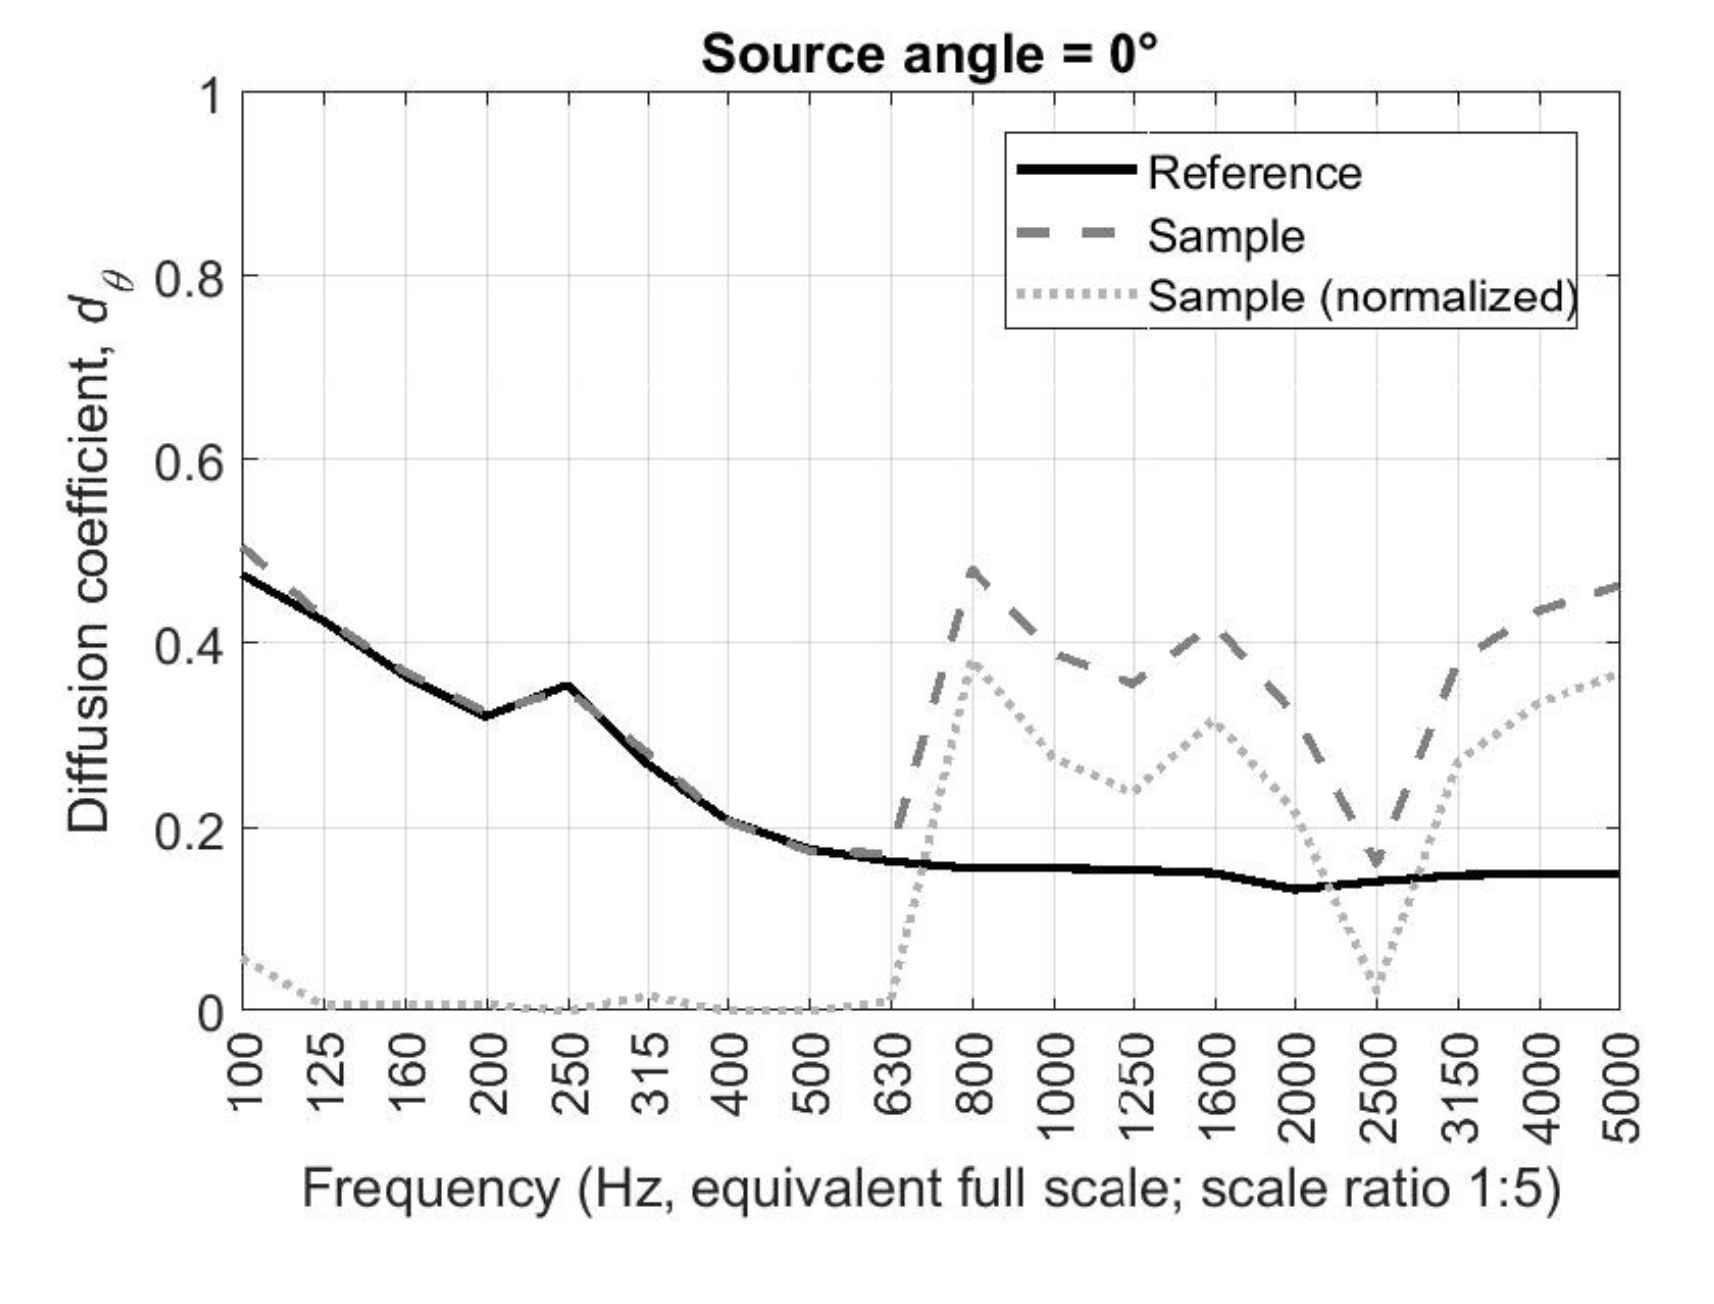
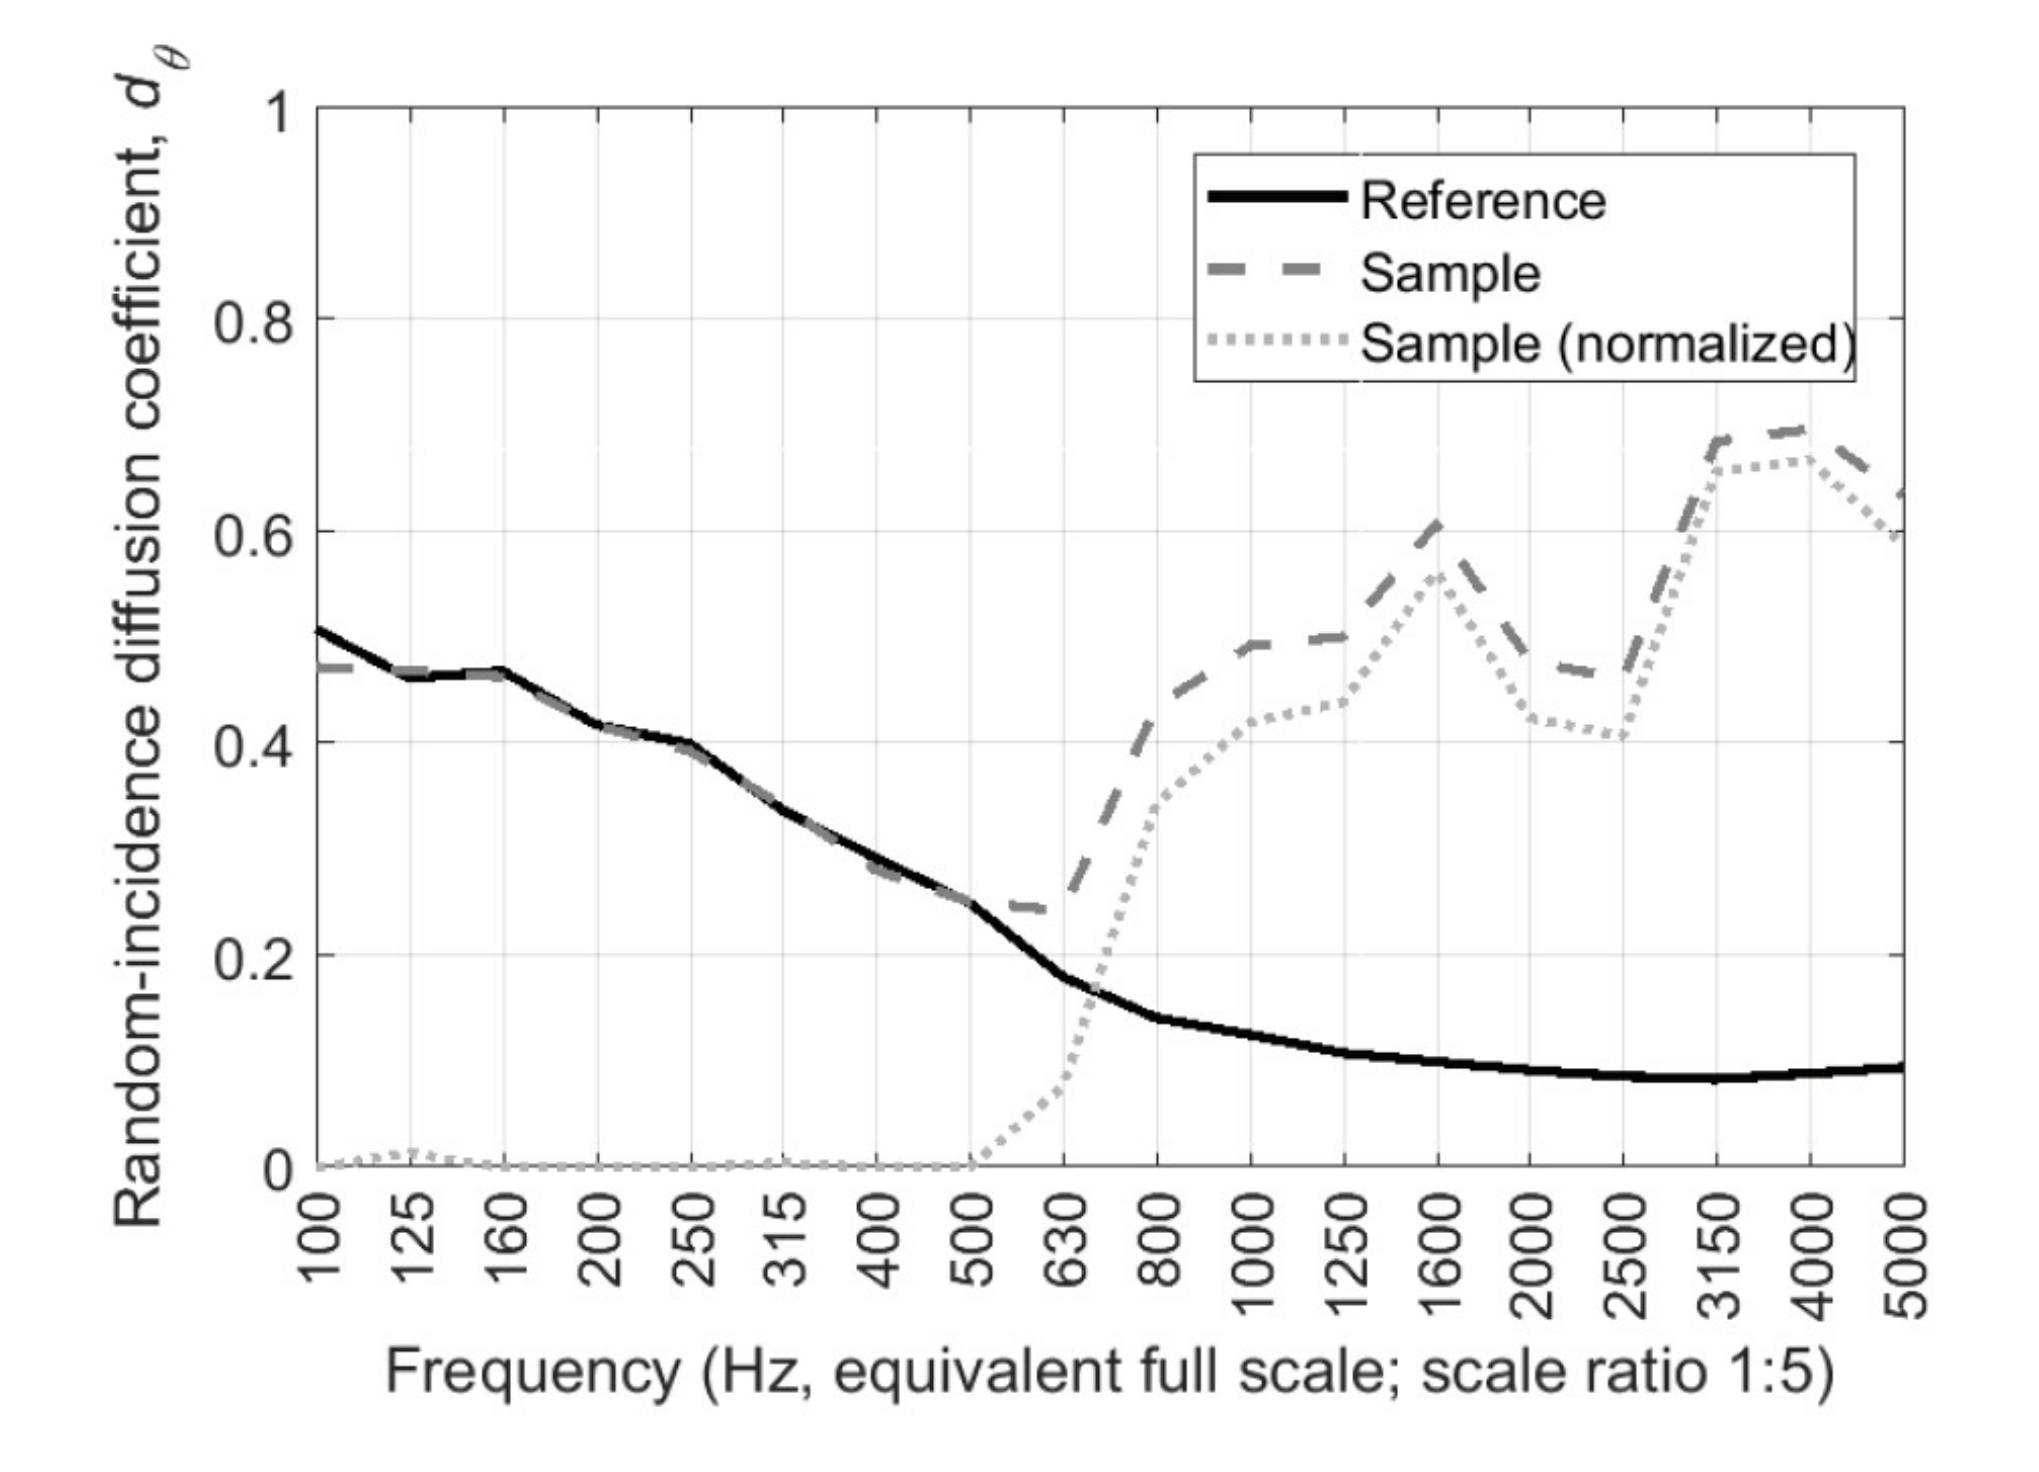
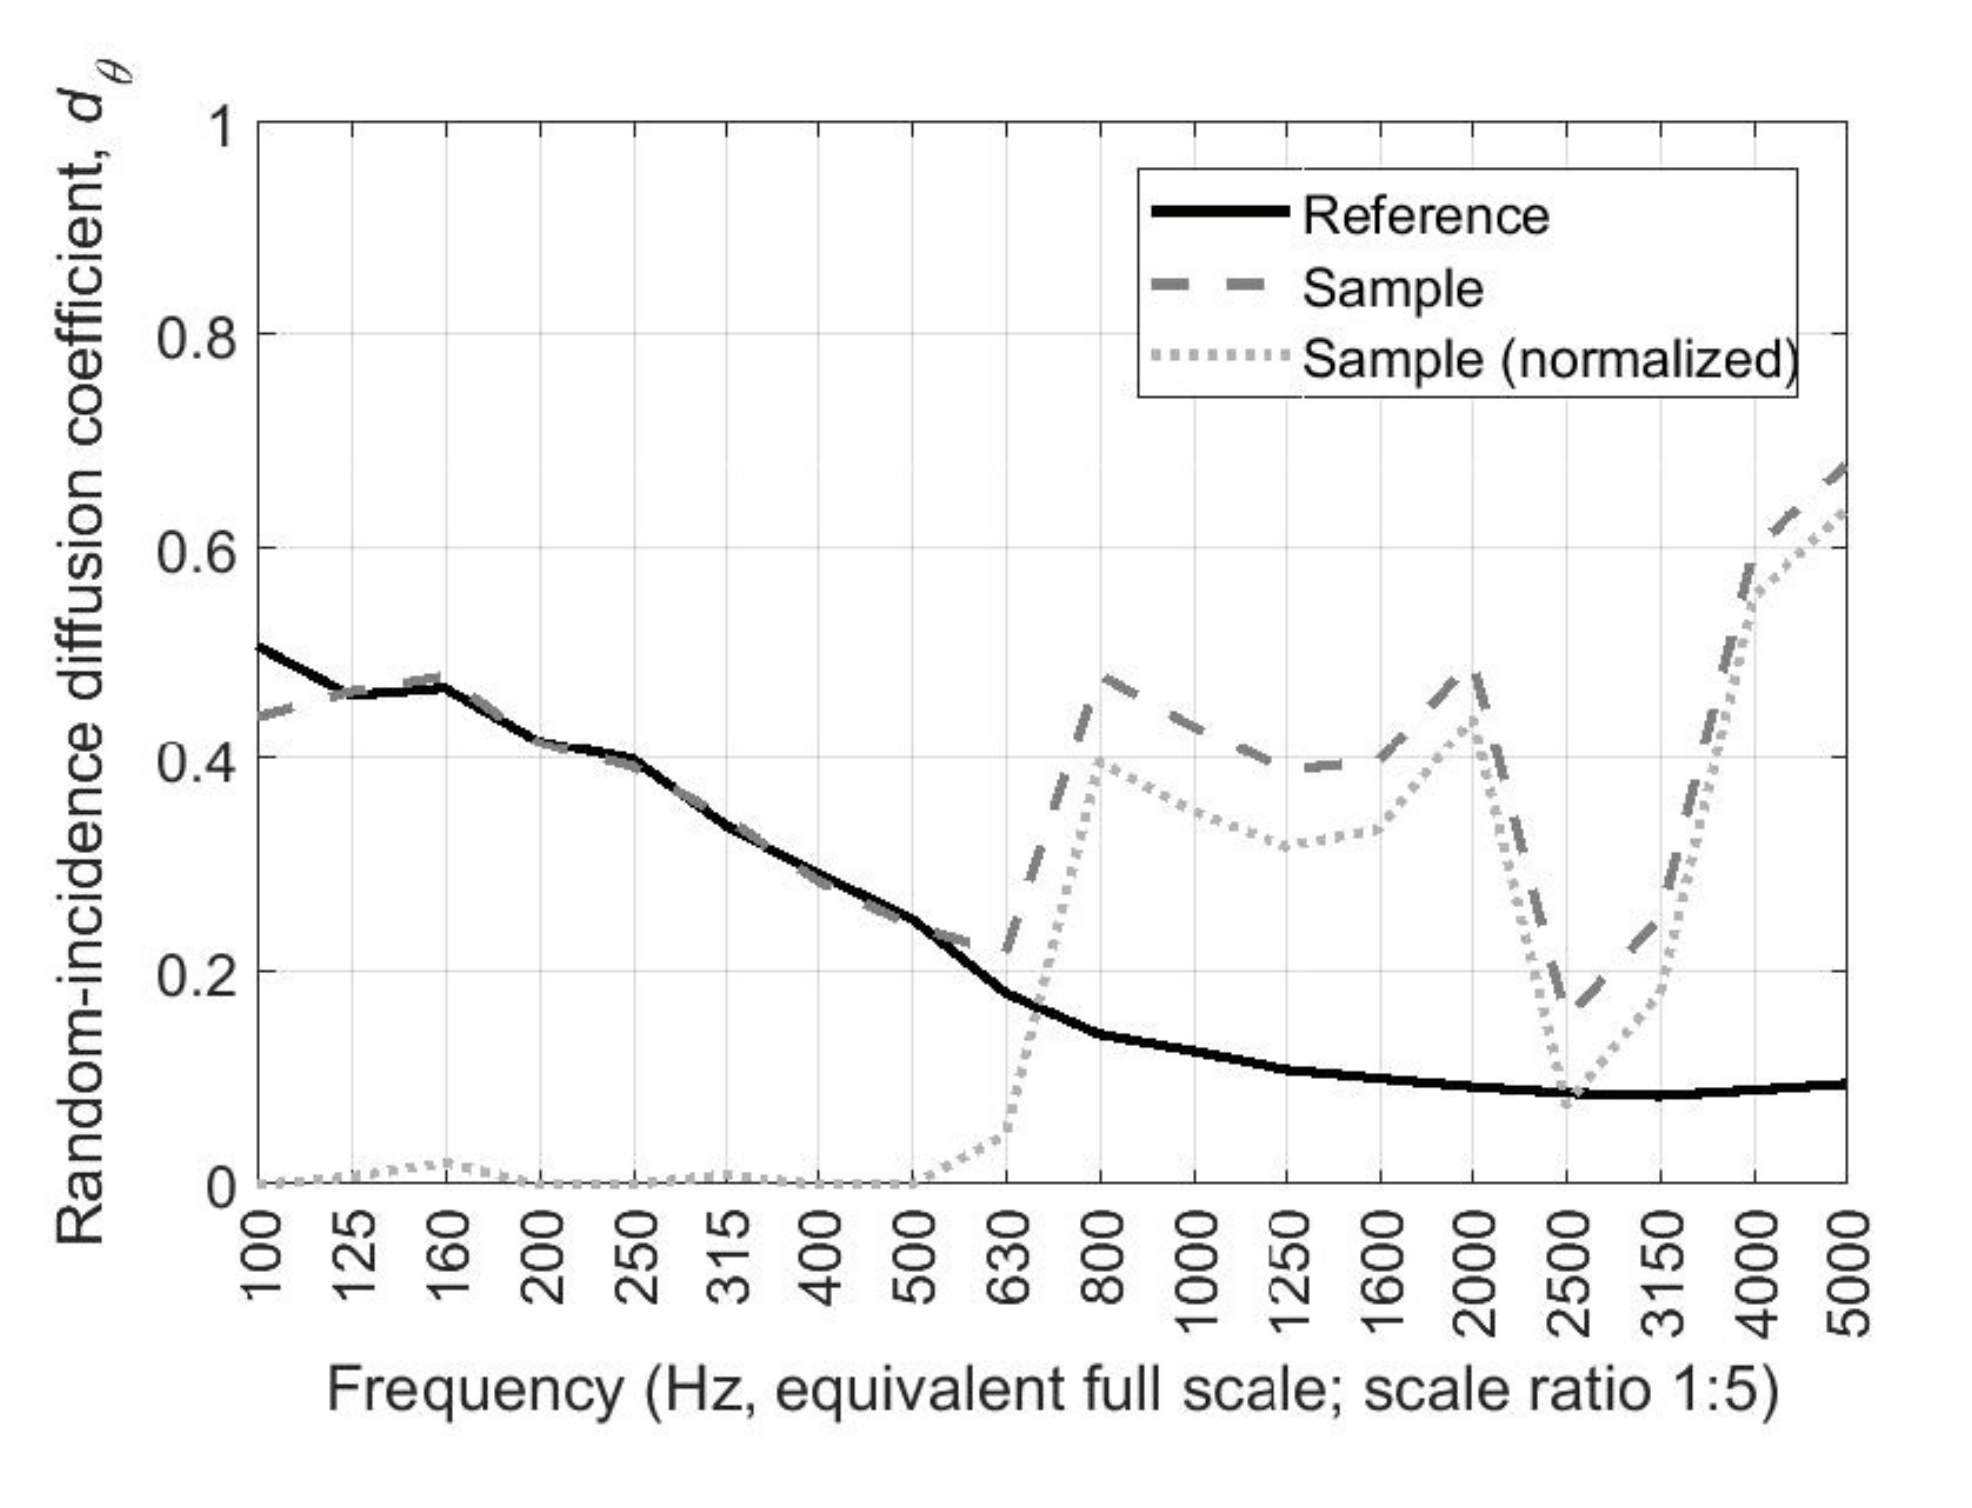
The 62-page diffusion report contained many graphs and polar plots from 100Hz to 5kHz.
Diffusion varies between frequencies dependent upon the angle of the source, the angle of the device, and the orientation of the box.
The graphs on the left show the far field diffusion coefficients for both orientation A and orientation B, with the random incident’s diffusion coefficients (Normalised and non-normalised).
The tests were conducted on 8x scaled boxes in two different orientations; Orientation A with the boxes rotated so that the long convex curves were in a vertical position and Orientation B with the boxes rotated so that the long convex curves were in a horizontal position.
A boundary plane method was used, with the scattering measured in the plane being defined by the hard concrete floor of the semi-anechoic chamber. Measurements made using 37 microphones arranged in an arch shape, Spanning from -90° to 90° With angle steps of 5°.
The loudspeaker source angles used 0°, +-30° and +-60°.
The 62-page diffusion report contained many graphs and polar plots from 100Hz to 5kHz.
Diffusion varies between frequencies dependent upon the angle of the source, the angle of the device, and the orientation of the box.
The graphs on the left show the far field diffusion coefficients for both orientation A and orientation B, with the random incident’s diffusion coefficients (Normalised and non-normalised).